Archive for the ‘Economy’ Category

Echo to my previous post — 3 Investment Opportunities From a Free Falling Oil Price, Goldman Sachs says oil refiners can average 25% gains in six months on Nov 18th.

Goldman Sachs analyst Neil Mehta is optimistic about oil refiner stocks, resuming the group at Attractive, adding Tesoro NYSE:TSO) to the firm’s conviction list and awarding Buy ratings to Marathon Petroleum (NYSE:MPC), Phillips 66 (NYSE:PSX) and Delek US (NYSE:DK).

The negative factors from 2013, such as shrank Brent-WTI spread, rumor about lift ban on US crude export, and heightened ethanol requirements, are behind us. Goldman predicts WTI crude oil price will remain weak near $70 in the 1st Q of 2015 unless OPEC cut its production level.

Mehta goes further to explain why he’s feeling optimistic about the group:

Refiners are defensive in a weak crude tape Given industry economics are driven more by crude spreads than the directional oil price – we believe refiners represent one of the few energy sectors that can grow cash flow in a declining crude price environment. In addition, we see a seasonal trading tailwind for refiners in 4Q/1Q.

Brent-WTI should widen out – a key positive We expect Brent-WTI spreads will widen out from $4/bbl currently to $10/bbl in 2015-2016 as US oil production/pipeline growth outstrips refining additions. 

Underappreciated Sum-Of-The-Parts (SOTP) value in midstream Midstream/MLP segments provide SOTP upside to refiners from growth, stability and cash flow.

Refiners offer FCF, returns and dividend yield We forecast refiners will generate 9%-11% of the current market caps in annual FCF and 15% ROCE in 2015/2016. Cash flow supports a healthy dividend yield of 3.0%, on median, for the sector.

Source: Barron’s article (link)

Cowen energy analyst team is also keeping a positive view on the refining sector due to solid underlying earnings potential and the developing theme of logistics growth. The firm sees 30%-40% stock price upside for Outperform-rated Delek S Holdings (NYSE:DK), Marathon Petroleum (NYSE:MPC), Western Refining (NYSE:WNR) and PBF Energy (NYSE:PBF).

2014 EIA Permian Basin InfrastructureMost of these refineries have more than 60% of the crude feed-stock sourced from Midland Basin in western Texas. Midland has seen tremendous growth in oil production due to proliferation of hydraulic fracking. The lower crude oil price may slow the frackers’ production rate but not a lot.

2014 EIA Permian Basin WTI Prices

Midland’s oil production outstrips the available pipeline infrastructure since 2009.  According to EIA Sept 2014 report (link), the spread between domestic WTI Midland and WTI Cushing oil prices is widening even faster than Brent-WTI spread.  A series of recent outages at refineries located in or near the Permian, and along the U.S. Gulf Coast caused the West Texas Intermediate (WTI) price at Midland to fall $17.50 per barrel below the price at Cushing, a record difference.

Being said, refiners, who purchase more light crude with cheaper WTI Midland, will benefit from this low oil-price environment.

Read Full Post »

Several hours before the Hong Kong Stock Exchange opens for trading on Nov 10th, they announced that the Shanghai-Hong Kong Stock Connect program will officially launched on Nov 17 (Mon).

China’s $9 trillion of mainland stocks and bonds was relatively untapped by foreign investors. This program is going to change the scene and transform Chinese RMB from trading currency into investment currency.

A wave of China A-Share ETFs is going to hit the US market. I will discuss that in the second half of this post.


Shanghai-Hong Kong Stock Connect

Greatly anticipated since the plan was first announced earlier this year, the cross-border trading link between Hong Kong and Shanghai, or so-called “through-train” is a very special financial reform to allow mainland Chinese investors to buy stocks listed in Hong Kong while global investors in Hong Kong to buy Shanghai-listed companies A-shares (*see note at the bottom about A-Shares vs. H-Shares).

The originally hoped-for launch date in late October was postponed amid the pro-democracy protests in Hong Kong. Since the announcement of this program in April this year, the Shanghai A-Share Composite Index has booked the longest run – 23% increase (from 2000 to 2467), far better than many emerging market indexes.

You can read more details about the program in my previous blog post.

Shanghai - Hong Kong Connect

With this new program coming in next Monday, it is estimated that everyday a maximum US$2 billion worth of mainland stocks can be traded by Hong Kong investors; vice versa about US$1.5 billion of Hong Kong stocks by mainland investors.

This program will attract more foreign investors to invest into Chinese A-shares listed in Shanghai stock market (which used to be very restricted to mainland investors only). I think the Shanghai stock market will benefit more with larger Northbound traffic.

Speculation that relaxed capital controls will entice index providers including MSCI Inc. to incorporate China’s local shares into global gauges is also attracting investors. Many suspect that it will happen in 2015. If yes, China alone could comprise 30 to 50 % of the developing-nation gauge in the next decade.

Another reason for more bullish A-Share market is that H-Share is usually traded at a higher valuation in Hong Kong for the same company traded in A-Share. The gap can be as wide as 30% for certain stocks. With the open of the Connect program, the gap is expected to exploit by arbitrage traders to drive A-Share higher.

You can find other interesting articles about the program — Shanghai-Hong Kong Stock Connect information you need to know! and this Infographic. Also, my blog – 4 Reasons to Have Chinese Stocks in Your Portfolio)

(Risks: Keep in mind that not all Chinese A-Shares are available for trading in this first launch of the Shanghai-Hong Kong Stock Connect. The Shanghai Stock Exchange has different trading rules, such as a 10% price limit, different holidays between mainland China and Hong Kong. Please read this 90-page presentation to understand the risks involved).


A-Share ETFs To Hit Global Market

2014-11-10 Shanghai SE Index - 2467

Shanghai Composite Index — up 23% from bottom 2000

Large money managers from BlackRock to CSOP Asset Management registered 40 ETFs tracking China’s onshore equity and debt market with US regulators.

There are about twice as many filings for ETFs that would invest in China’s onshore stocks and bonds than there are for funds seeking to trade only overseas-listed securities, according to data compiled by Bloomberg. For example, the Deutsche X-trackers Harvest CSI 300 Index (ASHR), launched just about a year ago, has certainly done very well by raising $458 million asset under management.

If you are new beginners in investing in China ETFs. There is difference in investing in China ETFs which trade H-Share stocks in Hong Kong vs. A-Share in Shanghai. Investors can benefit most from investing in A-Share is the low 38% correlation to the S&P 500 (vs. 65% with MSCI China H Index).  Besides, A-Share provides better exposure to 13% more Chinese consumer-related stocks than H-Share. Volatility is about the same in both H-Share and A-Share market.

You can find 23 H-Share ETFs in US which are placed in the China Equities ETF (etfdb.com). The famous ones are FXI, MCHI, GXC, and KWEB.  These ETFs only invest in H-Shares in Hong Kong and exclude A, B-Shares traded in mainland China.

New China A-share ETFs: ASHR, PEK, ASHS, CNXT, CHNA, KBA

There are 2 ETFs traded in Hong Kong Stock Exchange which you can buy indirectly into a basket of 49-50 mainland listed A-Share stocks: iShares FTSE A50 China Index ETF (2823.HK) and CSOP A50 ETF (2822.hk).


*The China mainland equity market is comprised of A, B, H, Red chip and P chip share classes. A shares are incorporated in China and trade on the Shanghai and Shenzhen exchanges; they are quoted in local renminbi and entail foreign investment regulations (QFII). B shares are incorporated in China, and trade on the Shanghai and Shenzhen exchanges; they are quoted in foreign currencies (Shanghai USD, Shenzhen HKD) and are open to foreign investors. H shares are incorporated in China and trade on the Hong Kong exchange and other foreign exchanges. Red chips and P chips are incorporated outside of China and trade on the Hong Kong exchange. Red chips are usually controlled by the state or a province or municipality. P chips are Nonstate-owned Chinese companies incorporated outside the mainland and traded in Hong Kong.

Read Full Post »

The West Texas Intermediate (WTI) crude oil price fell from $105/barrel on Jun 25th to $77 on Nov 5th, a drop of 26.7%, also a 3-year low. Last week, Goldman slashed their oil price forecast for Q1 2015 – expects Brent to be $85/bbl vs. $100 previously AND WTI $75/bbl vs. $90 previously (link). For sure, drillers and frackers will suffer but which businesses will benefit from this free falling crude oil price?

My investment focus is on US diversified and integrated oil refineries which can grow profit margin from the widening price gap between domestic crude oil and international refined oil product. I will discuss 3 investment opportunities at the bottom of this post.

Saudi/OPEC’s pricing power

Thanks to the so-called split-pricing (or discriminative pricing) by Saudi Arabia. What Saudi does is cutting crude prices for U.S. customers while selling at higher price to other countries. OPEC also cut production forecast in Nov-Dec. Apparently, this is a very targeted strategy by Saudi to force the blooming shale oil businesses in U.S. to slow down their production (if not driving them out of business). 2014-11-03 Ychart WTI spot price

$75 dollars a barrel

That’s the price crude oil would have to hit for frackers in North Dakota’s Bakken fields to feel pressure to slow new production, according to Greg Zuckerman, author of “The Frackers” and a special reporter at the Wall Street Journal. “All these guys have hedged. They’ve got production [and] they’ve already got the acreage. They’re not gonna stop but maybe they’ll kind of slow new stuff.”

In other parts of the U.S. the frackers are more resilient to free fall in oil prices this year. In Texas’s Eagle Ford and Permian basin, Zuckerman says oil prices would have to drop as low as $60 a barrel for production to be impacted.

(p.s. the Canadian sands production also becomes uneconomical at this low price for prolonged period. It may deter the approval of the Keystone pipeline bill in the US Congress even with a Republican dominance in the Washington.)

How big is fracking in US?

Analysts  say the fracking industry in the US grew from $18.4 billion in 2012 to $26 billion dollars in 2013 (source: BCC Research). We’ve gone from 5 million  barrels a day to 9 million in just about 5 or 6 years. The US is producing an additional 3 million barrels a day because of shale oil.  Overall, fracking is still a tiny fraction of the overall oil and gas industry in the United States. So, the industry is just in the third inning of a long & impressive revolution. Hard to believe a temporary crude oil over-supply will stop the revolution.

What is the real impact? A Supply Shortage in 2015?

In addition to targeting the US shale revolution, many believe that Saudis have other agendas: to target Iranians and Russian. While Russia supplies most of the the natural gas to Europe, the Ukraine relationship becomes an opportunity for Saudi or US to take market shares by exporting natural gas and other oil products to help free Europe  from Russian grandstanding.

Other oil export countries (such as Iraq, Iran, Libya, the North Sea, Venezuela, Nigeria)  built their government 2014-2015 budget based on $96-100/barrel. If the oil price continues to fall  $60-70, these countries may have budget deficit and are forced to lower their production in 2015.  By Q3 2015, we may see a tremendous oil supply constraints, shortage, that, “in turn will lead to the ‘super spike’ albeit from much lower levels than previously predicted” says Dan Dicker, president at MercBloc and author of Oil’s Endless Bid.

CEOs remain confident about profitability even in the world of $75 / barrel

Halliburton (HAL) CEO Dave Lesar is the most out-spoken one. He said that he is not particularly worried about falling oil prices, expecting them to climb next year.  Lesar believes the oversupply will quickly prove self-correcting, especially when it comes to U.S. shale production.  Unlike with conventional oil, shale wells peter out quickly and companies depend on constant new drilling to maintain production levels; lower prices will discourage new drilling, quickly removing the glut in crude supplies, Lesar says.

“We think there’s a lot of economic oil at $75… meaning we earn 15%, 16%, 17% returns,” Occidental (OXY) CEO Stephen Chazen said during earnings conference call last week.

Execs at several large U.S. shale producers, including CHK, EOG Resources (EOG) and Whiting Petroleum (WILL) said as they reported earnings that they plan to maintain and even raise production. Shale producers cite success in reducing costs as proof they can still be profitable at prices below $70/bbl; CHK says well costs at its two largest production areas – Pennsylvania’s Marcellus Shale and Texas’ Eagle Ford – fell 11% and 13% respectively Y/Y during the first seven months of this year.


Oil Refiners are the winners

Exxon (XOM), Chevron (CVX)’s recent earnings were boosted by refinery as oil prices slip. Both companies reported last Friday cited that 25% drop since July helped profit jump nearly fourfold.

The London-traded Brent Crude is usually higher than the WTI in US because it’s more expensive to drill and transport in Europe/Middle East.   So, the European refineries, which ship gasoline and diesel to our shores, must use the pricier Brent Crude. U.S. refiners, meanwhile, can undercut the importers whenever the gap between West Texas and Brent prices widen.

According to Citigroup, the gap may grow further.  Citigroup’s analysts expect rising U.S. output to push West Texas prices down even faster than Brent prices. What is now a $5 gap should grow to $8 next year, and $10 in 2016. The key takeaway: U.S. oil refiners will be able to produce gasoline, diesel, jet fuel and other distillates at much lower prices than their peers, setting the stage for rising domestic market share and a rise in exports.  (Btw, US government only allows refined product export but not US-produced crude oil. )

Risks to Consider: If U.S. oil producers decide to sharply cut output in the face of falling crude oil price, then the West Texas-Brent spread may narrow, which would negatively impact refinery margins.

For investors in refineries, there are 3 refineries (DK, ALDW, CVRR) on my radar. I did more in-depth research at DK while still reading earning reports for ALDW and CVRR.

1. Delek US Holding, Inc (DK)
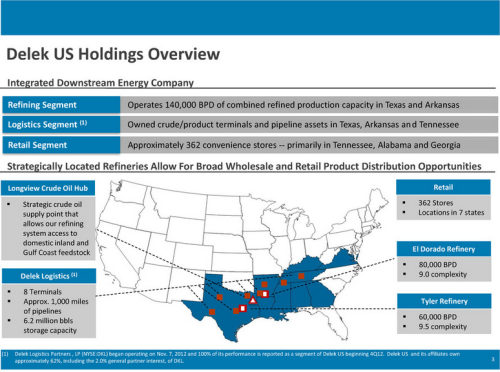
2014-11 DK modelDK is a —Texas/Mid-Atlantic based integrated energy business with focuses: petroleum refining, distribution, logistics, and convenience store retailing. Nov 6th’s earning and revenue from Q3 both beats analysts’ estimates (link). (Disclaimer: I am long DK)

  • —IPO in 2006 on NYSE
  • —$41/share in Feb 2013,  dropped to $19 in Oct
  • —We bought at $19-20/share in 2013 Oct
  • Forward P/E: 10.89 (vs. ttm 23), P/S: 0.23, Div Yield: 1.8%
  • —Major reasons for the significant decline in early 2013:
    • —Abnormal WTI > Brent spread in early 2013
    • —Government mandatory Ethanol permit (EPA scaled it back in late 2013)
  • —Catalysts for upside:
    • Successful —Tyler expansion in Q1 2015
    • Continued expansion of El Dorado
    • Growing spread between Midland WTI and Cushing WTI
    • Reduced cost in retail store operations
  • —Current price at $32.  1-year target: $ 48/share.  Analysts at Barclays project $50 target price.

2. Alon USA Partners LP (ALDW)

ALDW is a MLP.  Forward P/E: 7.05 vs ttm: 8.28,  P/S: 0.36.

Citigroup analysts call for 37.6% EPS growth and long term growth rate at 23.9%.

What’s more impressive (if it’ll happen) is that Citigroup forecasts it will generate a $2.64 dividend payment in 2015.  That’s a 15% yield, based on current prices. Current dividend yield is 2.6% ($18.81 / share as of Nov 6th).

Citigroup’s $22 target price adds 25% potential share price appreciation to that income stream.

3. CVR Refining, LP (CVRR)

CVRR is a MLP.  Forward P/E: 7.76 vs ttm: 8.39,  P/S: 0.38, Div Yield: 8.39%.

CVRR suffered a huge setback on July 24th (link) when a fire injured four employees at their Coffeyville refinery and they were forced to shut down its 115K bbl/day production.  Coincidentally, Carl Icahn reduced his position in CVRR for $6.5 million shares on July 1st (link). Following this sales, Mr. Ichan still owns over 70% of CVRR.

CVR Refining’s profitability is directly linked to the Brent-WTI spread, which has narrowed considerably in the past few months. Recent low oil price will increase the profit margin of the partnership.

What interests me is its longer-term growth in 2015. From past history, CVRR should be able to reopen the Coffeyville refinery in Nov/Dec and turn it back to full operation in 2015. CVRR management said that they would use the downtown to re-tune, expand Coffeyville and do their yearly maintenance in order to minimize disruption of production.

Investors can also consider bigger refineries – VLO and HFC. Alon USA and CVR Refining, LP offer the prospect of double-digit annual dividend yields, albeit with a high degree of seasonality, while the larger refiners such as Valero (VLO) and HollyFrontier (HFC) appear set to offer solid dividends and ongoing share buybacks.

Read Full Post »

Last Thursday , I attended the FOLEYTech Summit in Boston. Below are some key takeaways from a session by Robert Brown, MD and Co-President of North American, Lincoln International who led the discussion about the current state and trend of M&A in the small to middle market. This is an interesting topic which will lead to our next topic in this post:  Is Current Tech Valuations Too High?

2014-03-28 Global M&A

(p.s. the charts above and below are not part of the presentations in the FoleyTech Summit)

Deal-flow increasing, Valuation above pre-crisis, Seller’s market bloom but is it Peaked?

First, Robert acknowledged that since the beginning of US Fed’s QE, the market has been flooded with cash from all over the world which is a key driver for lots of M&A, PE activities in the past two years.  In the publicly traded market, this phenomenon is supported by ever-rising S&P 500 companies’ P/E multiples, and technology companies’ exuberant IPO valuations.

VC-funded hi-tech companies have been aggressively looking for deals and willing to pay extra premium to acquire smaller but more innovative companies to keep up growth momentum and eliminate future competitions. Example includes: Facebook’s $12B acquisition of Whatsapp. Proposed Time Warner $70B by Comcast or Yahoo rumored investment in Snapchat at $10B valuation. Perhaps, the Chinese eCommerce giant Alibaba’s $150B IPO kind of signaled the peak of the bull market.

Robert thinks the high multiple is mainly contributed by the fact that there are too many buyers but not many sellers. This is great market for sellers to demand higher valuation.  According to Brown, even for service – technology consulting type of companies, the EBITDA multiple can be as high as 8x in recent deals which he did (traditionally, service-oriented tech business averaged 3-4x only).

Other M&A reports indicated that most of the M&A deals are in the technology, energy, oil & gas sectors. Not surprisingly to see more deals driven by strategic than cheap valuation. More global acquirers from Asia, especially from China, show up in the chart.

One warning Brown gave is that the market valuation has peaked.  Towards the end of tapering, we should expect an increase of 0.5-0.75% to the interest rate in 2015, the overall valuation multiple will contract and shrink back to a median EBIDTA 7x to 8x instead of 10x at this moment. The number of M&A deals may still be growing next year but 2014 probably is the peak for high valuation.

2013 Global M&A Valuation Trends


Debating: Is Current Tech Valuations Too High?

“There’s too much capital and there’s very few places to invest it … risk is not being priced properly and so venture capitalists are taking high-risk, high-reward bets.” —  Randy Komisar, Kleiner Perkins

When we look into the specifics in the venture capital, angel investment market, we actually see the cycle has shifted from more seed investment (like in 2012-2013) to more Up Cycle for more Series B or beyond deals in 2014. You can see from the chart (source: “5 takeaways from US VC Q3 14” by Pitchbook) below, the # of VC Deals Closed dropped from 1,540 (2013 Q1) to 1,229 (2014 Q3) and the # of Seed/Angel Deals is slowing down significantly.

2014-10-23 PE-VC 2014 Q3 Deal Flow

However the bigger tech becomes bigger.  The number of U.S. tech startups receiving $1B+ valuations in their first financing round rose 133% Y/Y in 1H14, says CB Insights. Meanwhile, PriceWaterhouseCoopers estimates the amount of VC funding directed towards “software” companies (includes a lot of Internet-related funding) totaled $10.1B in 1H14, up from just $4.6B a year earlier. Uber’s $1.2B funding round (at a $17B valuation) helped boost PwC’s figure.

Many VCs are looking to boost the valuation for the ONE blockbuster successful company out of their 50 companies portfolio and hope for a exuberant exit. From the Pitchbook charts below, even though the number of exits has declined significantly but the pre-money series B valuation is getting higher.2014-10-23 US VC Exits by Quarter2014-10-23 PE-VC 2014 Q3 Series B Pre-Money Valuation by Sectors

The breakneck investment pace has led a slew of high-profile VCs to warn valuations have gotten stretched, if not suggest a fresh bubble is afoot. “No one’s fearful, everyone’s greedy, and it will eventually end,” declared Benchmark’s Bill Gurley in a recent WSJ interview. “I think that Silicon Valley as a whole or that the venture-capital community or start-up community is taking on an excessive amount of risk right now. Unprecedented since ‘’99.”

Marc Andreessen and Fred Wilson have warned startups to curb their spendthrift ways. Andreessen said: “When the market turns, and it will turn, we will find out who has been swimming without trunks on: many high burn rate co’s will VAPORIZE.”

Nevertheless, Menlo Ventures’ Venky Ganesan: “While we are in an up cycle, we are nowhere close to the top … There are pockets of irrational exuberance, but for the most part, I think it’s actually fine.”  As most investors say: “There is no tech bubble until the bubble is burst.”

The CB Insights article also interviewed few west coast angels. Some are actually investing in farmland and real estates in their portfolios to hedge against future downturn as we saw in 2011.  Scott Banister, an angel investor in Paypal, Uber said: “If I’m investing in technological change, I would like to have part of my portfolio invested in things that are resistant to value erosion due to technological change.”


To see more data and charts, you can download the “Five Takeaways from U.S. VC in 3Q” and charts from Pitchbook.com

You can also check out the aggregated investment dollars and # of deals from 1995 to 2014 on PwC Moneytree — link.

Read Full Post »

I usually don’t trade on macro and foreign currency (forex) but shorting the Euro seems to be an easy and low-risk short-term bet when US stock market becomes volatile at an expensive valuation.  On June 28th I first discussed several investment ideas on foreign currencies (previous blog) and my top pick at that time was short selling EUR-USD at 1.37-1.39 range. The euro is flat on Labor Day at $1.31.
I expect EUR to rebound shortly to 1.32-1.33 because I believe ECB may delay its decision to launch Quantitative Easing (QE) or large-scale purchases of public debt until the end of the year. (FYI, ECB will announce its next policy statement on Sept 4th). Longer term within the next 6 months, I believe 1.22-1.25 is a reasonable range for EUR to support the recovery and boost inflation.
I will discuss the easiest way to short sell EUR at the bottom of this blog.
2014-09-01 EUR-USD Yahoo Chart
My investment thesis
My primary investment thesis to short sell the EUR is very simple. Unlike US Fed, ECB is lacking the political power and tool to solve the Euro zone’s member country’ debt and deficits problems and most of the Euro zone countries’ (including Germany and France) public debt to GDP ratios are way above the upper limit (60%) stipulated by the EU Stability Pact (source: European Commission). For comparison, USA’s public debt to GDP ratio is about 70%.
euro-debt-to-GDP
Earlier this year, optimists were drawing conclusion too early that Euro zone had hauled out of the 18-month recession. Most of their PMIs did increase slightly in 2013 but very soon became stagnant and downward again in 2014 Q2.
In July, ECB President Mario Draghi hinted many times publicly that they would consider large-scale purchases of public debt to maintain a weaker EUR policy to enable recovery and growth (I discussed this in my previous blog).  Luc Coene, Belgium’s central bank governor and a member of the ECB governing council, also echoed Draghi that low inflation could turn into deflation quickly, increases the burden of debt and “then you have a negative spiral that develops like we saw in Japan.”

Two weeks ago, ECB President Mario Draghi spoke at the Jackson Hole, Wyo., central banking conference, emphasizing the lack of inflation in the euro zone and reiterating that the central bank is ready to act when necessary.

Germany’s 10-year bond yield fell to historic low – 0.90% on August 26, while its two-year debt yielded below zero. That 1.46 percentage-point gap between U.S. and German 10-year debt yields is the highest since 1999.

Given the strong US Dollar these days, any euro zone QE will push bond yield to fall further and cause investors move their cash away to invest in the US market instead. Therefore, ECB faces a difficult decision and may wait till end of 2014 to launch any QE.

Eurozone PMI slips more than expected in August (recently announced on Sept 1st)
The Markit Eurozone Manufacturing PMI fell to 50.7 in August vs. 51.8 in July and against a preliminary estimate of 50.8. Looking at some individual countries, the PMI slipped to 51.4 from 52 in Germany – the lowest level in about a year; Spain continues growth at 52.8 (down from 53.9); Italy falls into contraction, at 49.8 from 51.9 in August.
 “The slowdown in industry is likely to add further fuel to the fire for analysts expecting additional monetary or fiscal stimulus to be implemented,” —  Markit’s Rob Dobson.
Easiest way to short the EUR via ETF
You can use leverage to purchase forex Future on public exchanges. However, leverage bears significant risks and requires knowledge and expertise to trade.  For international investors with a long-term timeframe are better off using exchange-traded funds (ETFs: FXE, EUO, ERO, DRR, EUFX, ULE, URR) that have built-in leverage and pose less risk.

2014-09-01 EUO ETF 6-month chart

The two most common ETFs to short the euro are:

  • ProShares UltraShort Euro ETF (NYSE: EUO) — *YTD 8.44% return if you started shorting the EUR via EUO ETF earlier this year
  • Market Vectors Double Short Euro ETN (NYSE: DDR)

Investors can also short-sell or purchase put options against ETFs with a long position in the euro. Similar to currency scenario, short selling an ETF involves borrowing shares and immediately selling them with the agreement to repurchase them (ideally at a lower price). Meanwhile, put options are rights to sell the ETF that become more valuable when the price of the security declines.

Here are four ETFs that are long the euro:

  • CurrencyShares Euro Trust (NYSE: FXE)
  • WisdomTree Dreyfus Euro (NYSE: EU)
  • Ultra Euro ProShares (NYSE: ULE)
  • Market Vectors Double Long Euro ETN (NYSE: URR)

Read Full Post »

« Newer Posts - Older Posts »